Understanding turbulence measurement
Turbulence is measured using EDR (Eddy Dissipation Rate), a standardized metric that quantifies the intensity of turbulent air. The data below comes from thousands of real flights tracked during 2025, providing an accurate picture of which routes consistently experience the roughest conditions.
While uncomfortable, modern aircraft are designed to handle even severe turbulence safely. These routes experience higher-than-average turbulence due to geographical features like mountain ranges, atmospheric conditions, and weather patterns.
Most turbulent routes by continent (2025 data)
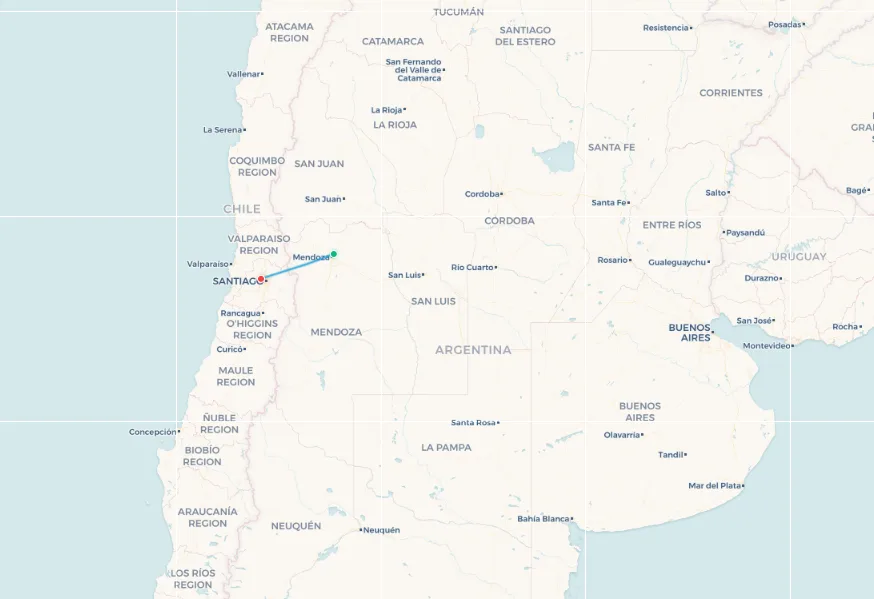
South America: Mendoza (MDZ) to Santiago (SCL) - 196 km
Flight Time: ~45 minutes
Primary Cause: Andes mountain range crossing
This short hop across the Andes between Argentina and Chile takes the crown as the world's most turbulent commercial route. The flight crosses some of the highest peaks in the Americas, creating severe mountain wave turbulence year-round. The dramatic elevation changes and unpredictable wind patterns over the Andes make this consistently the roughest ride in commercial aviation.
📥 Download route data (CSV) | 🗺️ Track this route in the app
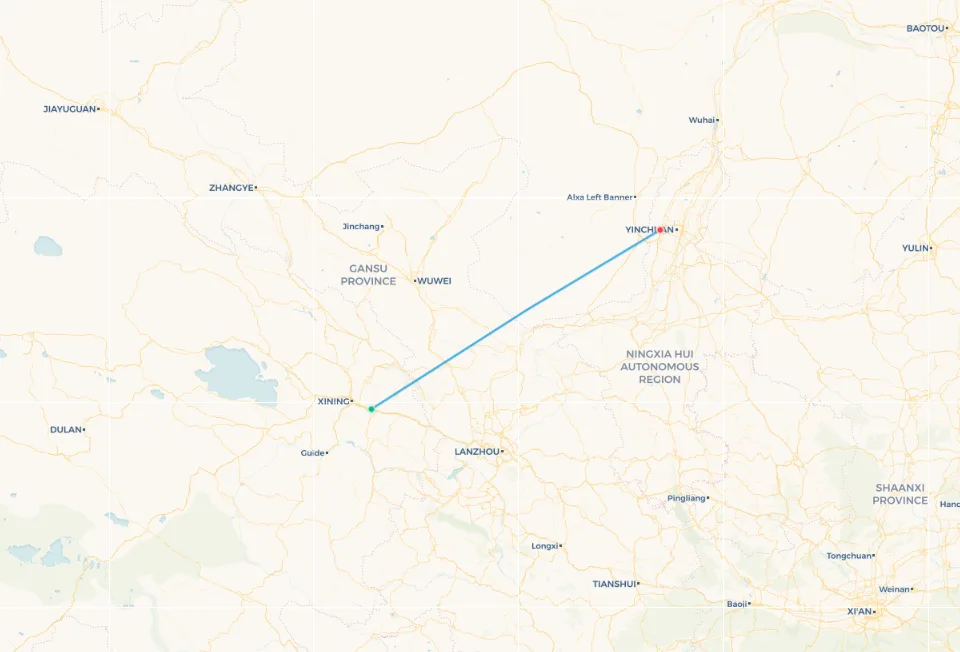
Search flights Mendoza → Santiago Search flights MDZ → SCLAsia: Xining (XNN) to Yinchuan (INC) - 433 km
Flight Time: ~1 hour 15 minutes
Primary Cause: Tibetan Plateau edge and complex terrain
Flying along the edge of the Tibetan Plateau in northwestern China, this route encounters severe mountain wave turbulence. The dramatic elevation changes and high-altitude terrain create persistent rough air that challenges even experienced pilots throughout the year.
📥 Download route data (CSV) | 🗺️ Track this route in the app
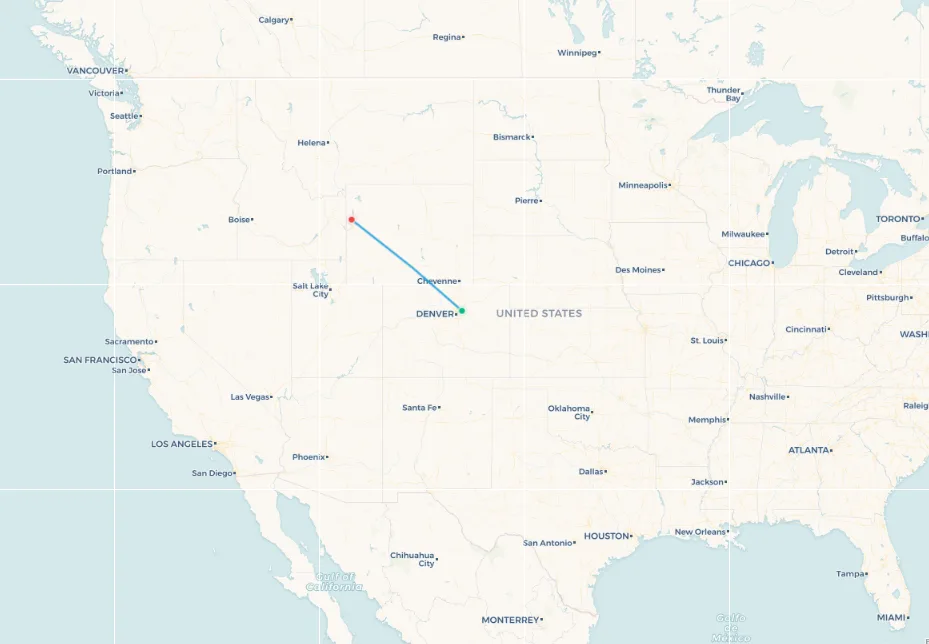
Search flights Xining → INC Search flights XNN → INCNorth America: Denver (DEN) to Jackson (JAC) - 653 km
Flight Time: ~1 hour 40 minutes
Primary Cause: Rocky Mountains and high elevation airports
This route connects two high-altitude airports across some of the most rugged terrain in the Rocky Mountains. Both Denver and Jackson Hole are notorious for turbulent approaches, and the flight path between them crosses multiple mountain ranges with strong wind patterns and unpredictable updrafts and downdrafts.
📥 Download route data (CSV) | 🗺️ Track this route in the app
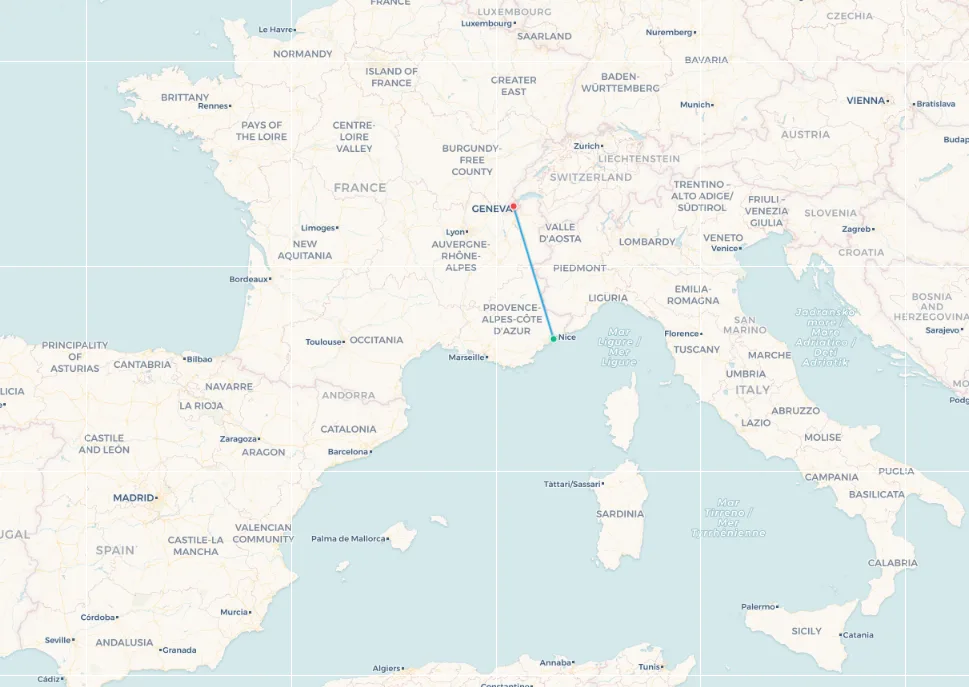
Search flights Denver → Jacksn Hole Search flights DEN → JACEurope: Nice (NCE) to Geneva (GVA) - 299 km
Flight Time: ~1 hour
Primary Cause: Alps mountain crossing
This short flight across the Alps from the French Riviera to Switzerland encounters consistent turbulence due to mountain wave effects. The dramatic elevation change from sea level in Nice to the Alpine terrain creates challenging flying conditions, particularly when combined with weather systems moving through the region.
📥 Download route data (CSV) | 🗺️ Track this route in the app
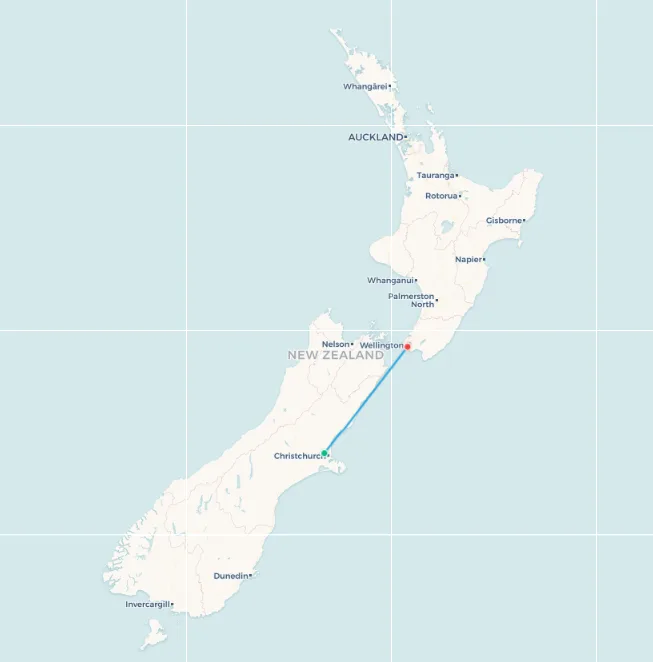
Search flights Nice → Geneva Search flights NCE → GVAOceania: Christchurch (CHC) to Wellington (WLG) - 304 km
Flight Time: ~1 hour
Primary Cause: Cook Strait winds and Southern Ocean weather
Wellington is famously one of the world's windiest cities, and this New Zealand domestic route must navigate the notorious Cook Strait. Strong winds funneling through the strait, combined with weather systems from the Southern Ocean, create consistently turbulent conditions that make this one of the bumpiest short flights globally.
📥 Download route data (CSV) | 🗺️ Track this route in the app
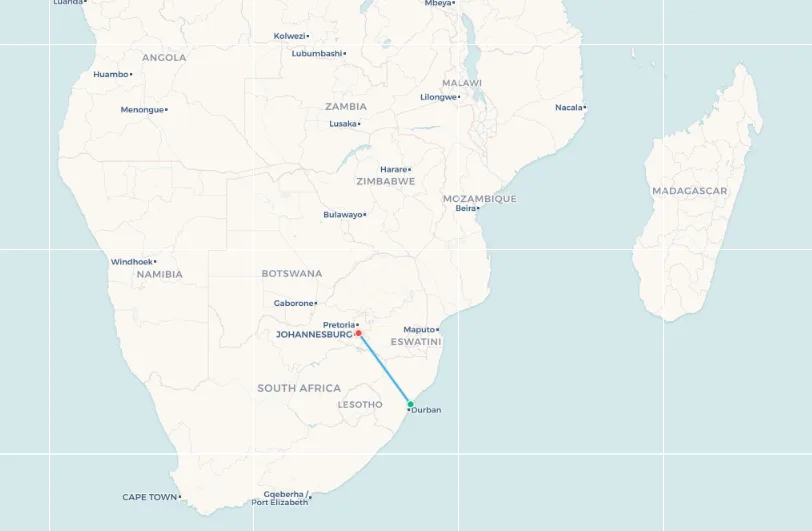
Search flights Christchurch → Wellington Search flights CHC → WLGAfrica: Durban (DUR) to Johannesburg (JNB) - 478 km
Flight Time: ~1 hour 15 minutes
Primary Cause: Drakensberg mountains and convective activity
This heavily-traveled South African route crosses the Drakensberg mountain range, creating mountain wave turbulence year-round. Summer months bring additional convective activity with afternoon thunderstorms building over the highveld, adding another layer of rough air to an already bumpy flight.
📥 Download route data (CSV) | 🗺️ Track this route in the app
Search flights Durban → Johannesburg Search flights DUR → JNBThe most turbulent routes in one map
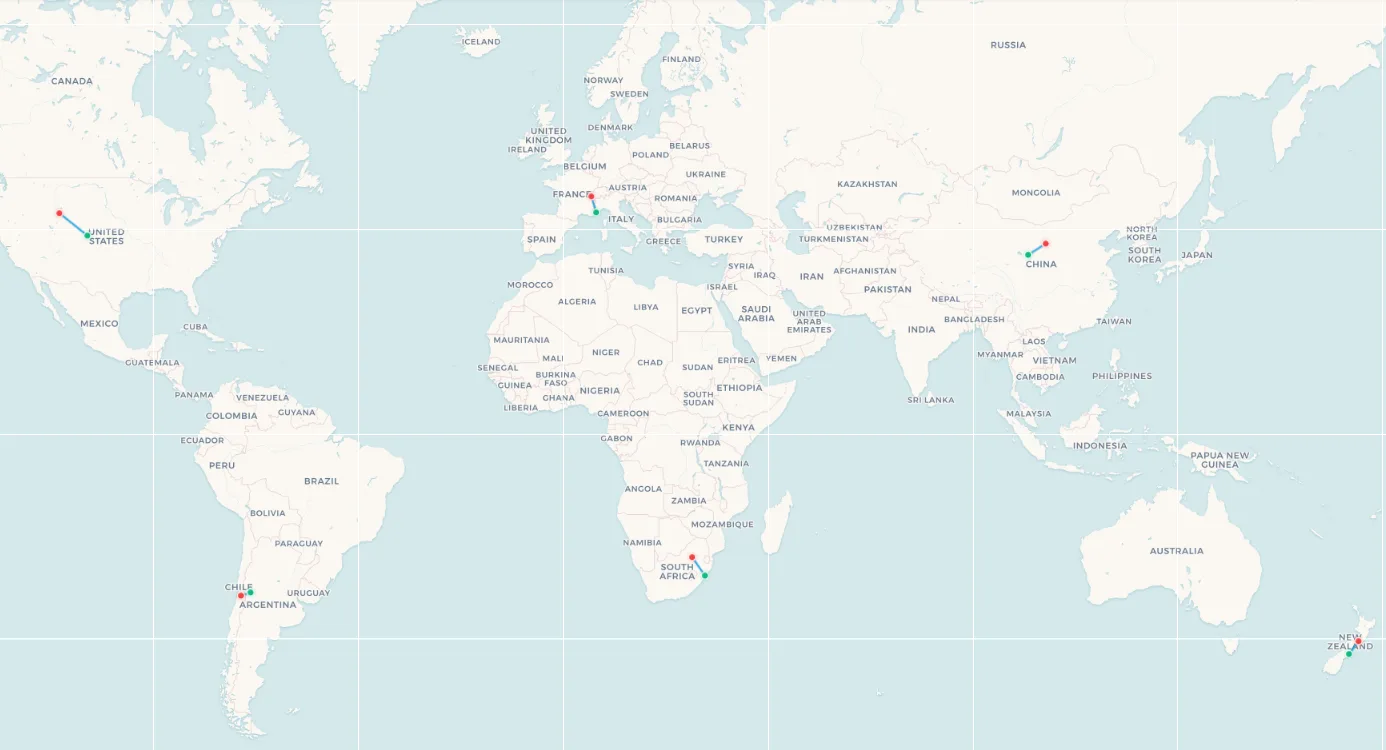
📥 Download all routes data (CSV) | 🗺️ View all routes on interactive map
Why these routes are so bumpy
All six of these routes share common characteristics that create persistent turbulence:
- Mountain Ranges: Five of the six routes cross major mountain ranges (Andes, Rockies, Alps, Tibetan Plateau, Drakensberg)
- Elevation Changes: Rapid changes in terrain elevation disrupt airflow and create mountain wave turbulence
- Geographic Funneling: Cook Strait acts as a wind tunnel, intensifying turbulence
- High-Altitude Operations: Several routes operate at or near aircraft performance limits
- Year-Round Consistency: These aren't seasonal phenomena - the turbulence is structural and persistent
Types of turbulence
Understanding the different types of turbulence helps explain why certain routes are consistently bumpy:
- Mountain Wave Turbulence: Created by air flowing over mountain ranges - the primary cause on most of these routes
- Clear Air Turbulence (CAT): Invisible to radar, caused by jet streams and wind shear
- Convective Turbulence: Associated with thunderstorms and rising warm air
- Mechanical Turbulence: Caused by air flowing over irregular terrain
- Wake Turbulence: From other aircraft, typically near airports
Modern turbulence detection
Airlines and pilots use several tools to minimize turbulence encounters:
- Weather Radar: Detects precipitation and storm cells
- PIREPs: Pilot reports from other flights sharing real-time conditions
- Turbulence Forecasts: Computer models predict CAT and other turbulence types
- Satellite Data: Monitors weather patterns and atmospheric conditions
- EDR Measurements: Real-time turbulence intensity data from aircraft sensors
- Historical Data: Services like Turbli track turbulence patterns to identify consistently rough routes
Staying safe during turbulence
While turbulence can be uncomfortable, it's rarely dangerous. Follow these tips:
- Keep your seatbelt fastened whenever seated, even when the sign is off
- Follow crew instructions immediately when the seatbelt sign illuminates
- Secure loose items that could become projectiles
- Avoid using the lavatory during rough air
- Stay calm – modern aircraft are designed to handle severe turbulence
Climate change and turbulence
Research suggests climate change is increasing the frequency and intensity of clear air turbulence:
- Jet streams are becoming more unstable due to warming Arctic regions
- CAT over the North Atlantic has increased by 15% since 1979
- Future projections suggest a 2-3x increase by 2050-2080
- Airlines are investing in better prediction and avoidance systems
Track your bumpy flights
Have you experienced any of these turbulent routes? Add them to My Flight Routes to visualize your journey and compare your experiences. Understanding which routes are historically bumpy can help you prepare mentally for the ride – and appreciate the skill of pilots who navigate these challenging conditions daily.
Data source: Turbli Historical Data 2025